 A new study from the Northwest Evaluation Association may help finally bring an end to the lies about using testing and "accountability" to close the ahievement gap. Once again the evidence shows, this time using test scores from over a half-million kids, that the current educational genocide is doing nothing for the poor except leaving them further behind academically, while turning their schools into chain-gang camps that snuff out any remaining pride and hope through repeated failures. Will the reform-by-wishful-thinking crowd at Ed Trust finally get the message? No achievement gap will be closed without addressing the poverty gap because these gaps are one and the same.
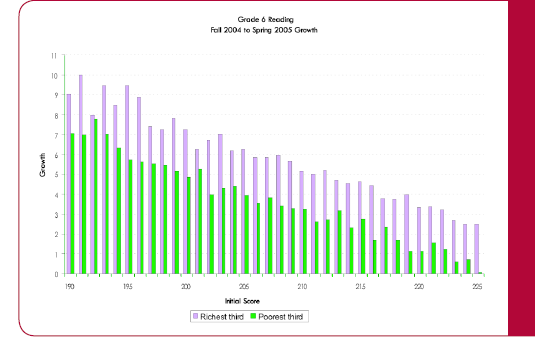
Below is the press release, links, and a couple of charts from the study. The first graph (above) shows that "when growth is broken out by initial skill, it is evident that students in minority groups and those in high-poverty schools are not making as much progress during the school year as their peers. The graph . . . is typical of observed growth" (click graph to enlarge). The second graph (below) shows that "during the summer months African-American and Hispanic students and students in poorer schools do not fare as well academically as their peers. The chart illustrates the pattern that is repeated at each grade level in both reading and mathematics for all of the groups studied."
PORTLAND, Ore.--(BUSINESS WIRE)--Northwest Evaluation Association (NWEA) researchers released today a new study on the achievement gap, the difference between the academic performance of students in poor and wealthy schools and between minority and non-minority students. The study revealed that for every group at every grade students from poor schools grew less than students from wealthy schools and minority students exhibited less growth than their non-minority peers.This study was designed to provide information about the achievement gap from the viewpoints of status (one point in time) and growth (academic improvement following a group over time). When individual student performance is followed across time, it is possible to see the effects of instruction more clearly giving educators better tools for identifying best practices.
The study found that no rate of change/growth in any minority group was sufficiently strong enough to close or reduce the observed achievement gap between groups of students in any substantive way before the end of their K-12 career. While the study shows no evidence that the achievement gap is closing, the intent of the study was not to identify causal factors.
In general, students enrolled in high-poverty schools, African-American students and Hispanic students begin school with lower skills, grow less academically during the school year and lose more skill over the summer than their wealthier and European-American peers. In the case of the African-American students in these samples, the concern carries added emphasis. Their rate of change over the two-year projection was the lowest of all groups, suggesting that the achievement gap between student segments remains a significant problem.
“This study should be a wake-up call for educators, as it reveals real differences in student achievement based on socio-economic status,” said Allan Olson, president of NWEA. “The use of growth data provides a clear picture of individual student growth and helps inform educators on specific areas where students need focused instruction.”
The overall study contains three component studies. The first study looks at group differences between average scores taken at one point in time and between average student growth over the course of one school year. The second study uses a more complex model to evaluate aggregate growth over two years. In the third study both status and growth are examined in more detail with results displayed for each score point. This reveals patterns obscured in aggregate data and shows that growth differences for African-American, Hispanic and students in high-poverty schools are more severe than summary data suggests.
The number of students used for this study was 569,564 for reading and 542,057 for mathematics in 24 states. The first and third studies use data from a set of students in grades 3 through 8 who took Northwest Evaluation Association tests in fall of 2004 and spring of 2005. The second study used student test records from the beginning of grades 4 and 7 for both reading and mathematics for students beginning in the fall, 2003 and continuing through spring, 2005. In addition each student’s ethnic group membership and their school’s percentage of free and reduced-price lunch (FRL) were considered. The FRL percentages were obtained from the National Center for Education Statistics (NCES) Common Core of Data for 2002-2003.
“This study shows that minority and non-minority students who start at the same place are growing at different rates, so the achievement gap between them actually widens over time,” said NWEA’s Chief Research and Development Officer, G. Gage Kingsbury, Ph.D. “Accelerating the growth for high-performing low-income and minority students as well as for students below standard is recommended to close the gap in the short run.”
Study data were supplied through NWEA’s Growth Research Database (GRD), one of the most expansive repositories of longitudinal data on student growth in the country. The database comprises data of interest to education researchers, including assessment data gathered from NWEA member districts. These data provide a detailed look at academic growth and aggregated proficiency levels. In addition, the tests from which the data are derived are more sensitive for low- and high-performing students, giving a more accurate picture of achievement.
In addition to its focus on research to improve assessment and the use of assessment data, NWEA also develops testing systems, including a growth measure called Measures of Academic Progress (MAP), in use at more than 2,400 school districts across the nation. The GRD includes data from the MAP.
The NWEA study builds on findings that this independent national education research group released in April 2005, April 2004 and November 2003. The 2005 study showed student achievement has improved since the No Child Left Behind (NCLB) legislation was passed but student growth has declined slightly. In 2004 the study indicated that Adequate Yearly Progress (AYP) measures are not a complete picture for judging school effectiveness. The 2003 study demonstrated that state standards of proficiency differ substantially from state to state, grade to grade, and subject to subject. These studies can be found at: http://www.nwea.org/research/national.asp.
The new report is available at http://www.nwea.org/research/gap.asp.

I am amazed that it takes a study using an enormous amout of research and finances to reveal something that individuals in the African-American community has known all along. Poverty equals low achievemnt. How can John focus on math and science when he is sitting in class hungry, lights off at home, and his mother has no money to provide him with clean clothes to wear to school?
ReplyDeleteAs a teacher in a school where poverty plays a major role, I agree. However, legislators are not of the same school of thought. These officials make laws based on "poorly equipped teachers" in inner city schools. This legislation is institutionalized elitism.
Delete